Market Intelligence
HVACR Map of the Month: Half of Housing Growth Lands in 4% of ZIP Codes
November 2, 2026 | 5 minute read
Welcome back for our second edition of the HVACR Map of the Month. In October we mapped the age of the housing stock. This month we're looking at where it's growing, using Esri's forecast of housing unit change for every ZIP code in the country from 2026 to 2031.
The national picture
Esri's 2026 estimates count roughly 149.3 million housing units across the 32,183 ZIP codes on the map, and its forecast adds a net 5.4 million of them by 2031, a gain of 3.6% over five years. Texas alone accounts for about 1.05 million of that (19%) and Florida for another 721,000 (13%). The next three states, California, North Carolina and Georgia, combined add fewer units than Texas does.
The distribution underneath is even more lopsided than the state ranking suggests. Half of the national gain lands in just 1,413 ZIP codes, about 4% of the total, and the top tenth of ZIP codes by unit gain account for 72% of all additions. At the other end, 3,266 ZIP codes are forecast to lose housing units and another 7,250 are essentially flat.
Why housing growth belongs on a map
A state number is an average of its ZIP codes, and very few ZIP codes look like the average. Texas leads the country at 8.0% growth over five years, and 136 of its 1,841 ZIP codes are still forecast to lose housing units. Ohio sits at 1.3%, near the bottom of the large states, and still has 84 ZIP codes projected to add more than 250 units each. Neither state has many territories that behave like its headline rate.
Metro averages can also blur in the same way. Inside Dallas-Fort Worth, Forney is projected to add 12,922 units, a 35% gain, and Celina 9,930, up 51% — gains that sit in a few ZIP codes on the edge of the metro rather than across it. Parrish, Florida adds 7,779 on the same pattern.
Branch siting, territory design, which contractors get the next sales call, whether a new-construction program is worth running — those get decided at the ZIP and neighborhood level. That’s the resolution the map works at, and it’s the resolution a state or metro average can’t give you.
Reading the housing growth map
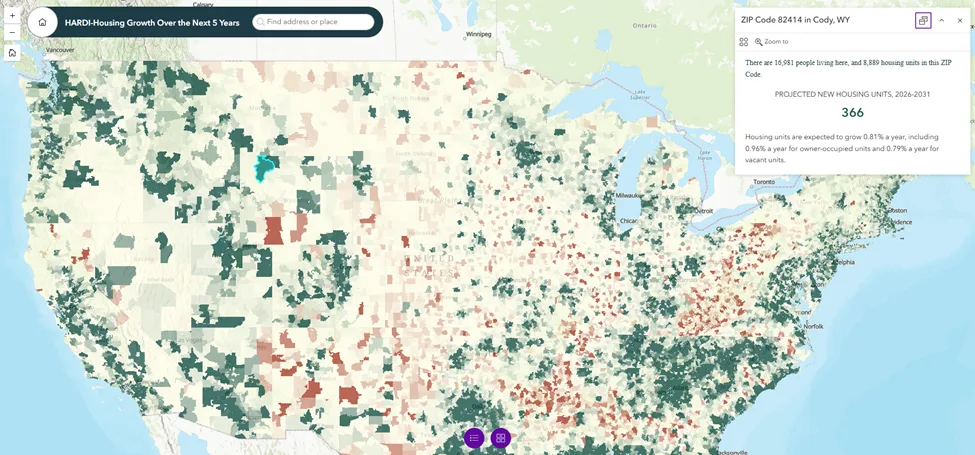
Each ZIP code is shaded by its projected change in housing units from 2026 to 2031. Teal marks gains and red marks losses, with the scale topping out at more than 250 added units and bottoming out at a loss of more than 81. Click any ZIP and the popup gives you its 2026 population and housing units, the projected change in units, and growth rates for total, owner-occupied and vacant housing. The search bar takes an address, so you can go straight to a branch or a territory.
Two things are worth checking before you draw conclusions from the color. The first is that the shading shows units, not percentages. A ZIP adding 300 units to a base of 30,000 looks the same as one adding 300 to a base of 600, so check the base in the popup. The second is that the growth rates in the popup are annual. In Mascotte, Florida (34753), the 5.93% rate compounds to 854 added units over five years, a 33% gain on 2,557 units today.
The owner-occupied and vacant rates are worth a look too. They can sit far apart inside the same ZIP. In Mascotte, vacant units are projected to grow at 13.02% a year against 6.55% for owner-occupied.
Read the color for the general pattern, the popup for the answer.
What HVACR Distributors can take from it
The concentration is what makes this interesting. When half of the net gain sits in about 4% of ZIP codes, a territory plan built on state or metro growth rates will overweight places that are growing slowly and miss the specific ZIPs where new equipment demand, new contractors and new competition are likely to show up first. Pairing the projected unit change with the base in each popup lets you size a territory by how many units are being added.
This also pairs well with our October HVACR Map of the Month. Housing age shows where the stock is old and replacement work is building, while housing growth shows where the stock is expanding. Read together, the two maps show which territories are about to grow, which are aging in place, and which are doing both.
Remember, this is a modeled projection and not necessarily a demand forecast. It nets out to a change in unit counts, and it doesn't tell you what gets built, what gets sold through the channel or who is installing it. It's the geographic layer underneath those questions.
This is only part of the story.
Housing growth is one layer, and we can go a lot deeper by stacking it with housing age, income, tenure, and your own territories and branch footprint at the same resolution. GeoInsights is HARDI's new interactive mapping platform, built to put market geography in members' hands and customizable to what you actually need to see. If you want to explore these, other insights, and/or custom spatial analytics against your footprint, contact the Market Intelligence team.

Joey James
Senior Research Analyst
Joey James is a Senior Research Analyst on HARDI’s Market Intelligence team. He has over a decade of experience delivering data-driven insights across the public, private, and nonprofit sectors. He has worked in markets around the world, helping organizations make better decisions through market analysis, impact assessments, and forecasting. He is passionate about turning data into insights that drive growth and improve outcomes.

You might be interested in...

Market Intelligence
Understanding the Numbers: AHRI Shipment Report Breakdown for August

Market Intelligence
Canada Tariff Scope Shifts Again — and the Bigger Exposure Is Already Live
Market Intelligence