Market Intelligence
The Sky Is Not Falling
June 14, 2022 | 5 minute read

The Sky Is Not Falling
Despite the headlines residential demand has not faltered, and its growth prospects remain strong.
Inflation, rising interest rates, war, and the prospects of a global famine have left many soothsayers wondering if an economic “hurricane” is on the horizon. Those fears have bled into our industry which, despite record sales growth continuing for distributors, have many observers feeling downright jittery about the future of demand -- specifically residential demand. In separate reports, analysts from both J.P. Morgan and Bank of America express concern that too much inventory is in the channel, with J.P. Morgan estimating that inventory levels are anywhere from 5-10 percent too high. With industry price levels currently 23 percent greater than one year ago and consumer sentiment lower than at any time during the pandemic, it’s hard to argue that analyst concerns are misplaced. Nevertheless, the long-term fundamentals of resi demand remain strong and I urge HARDI members to ignore the macroeconomic “noise” where possible.
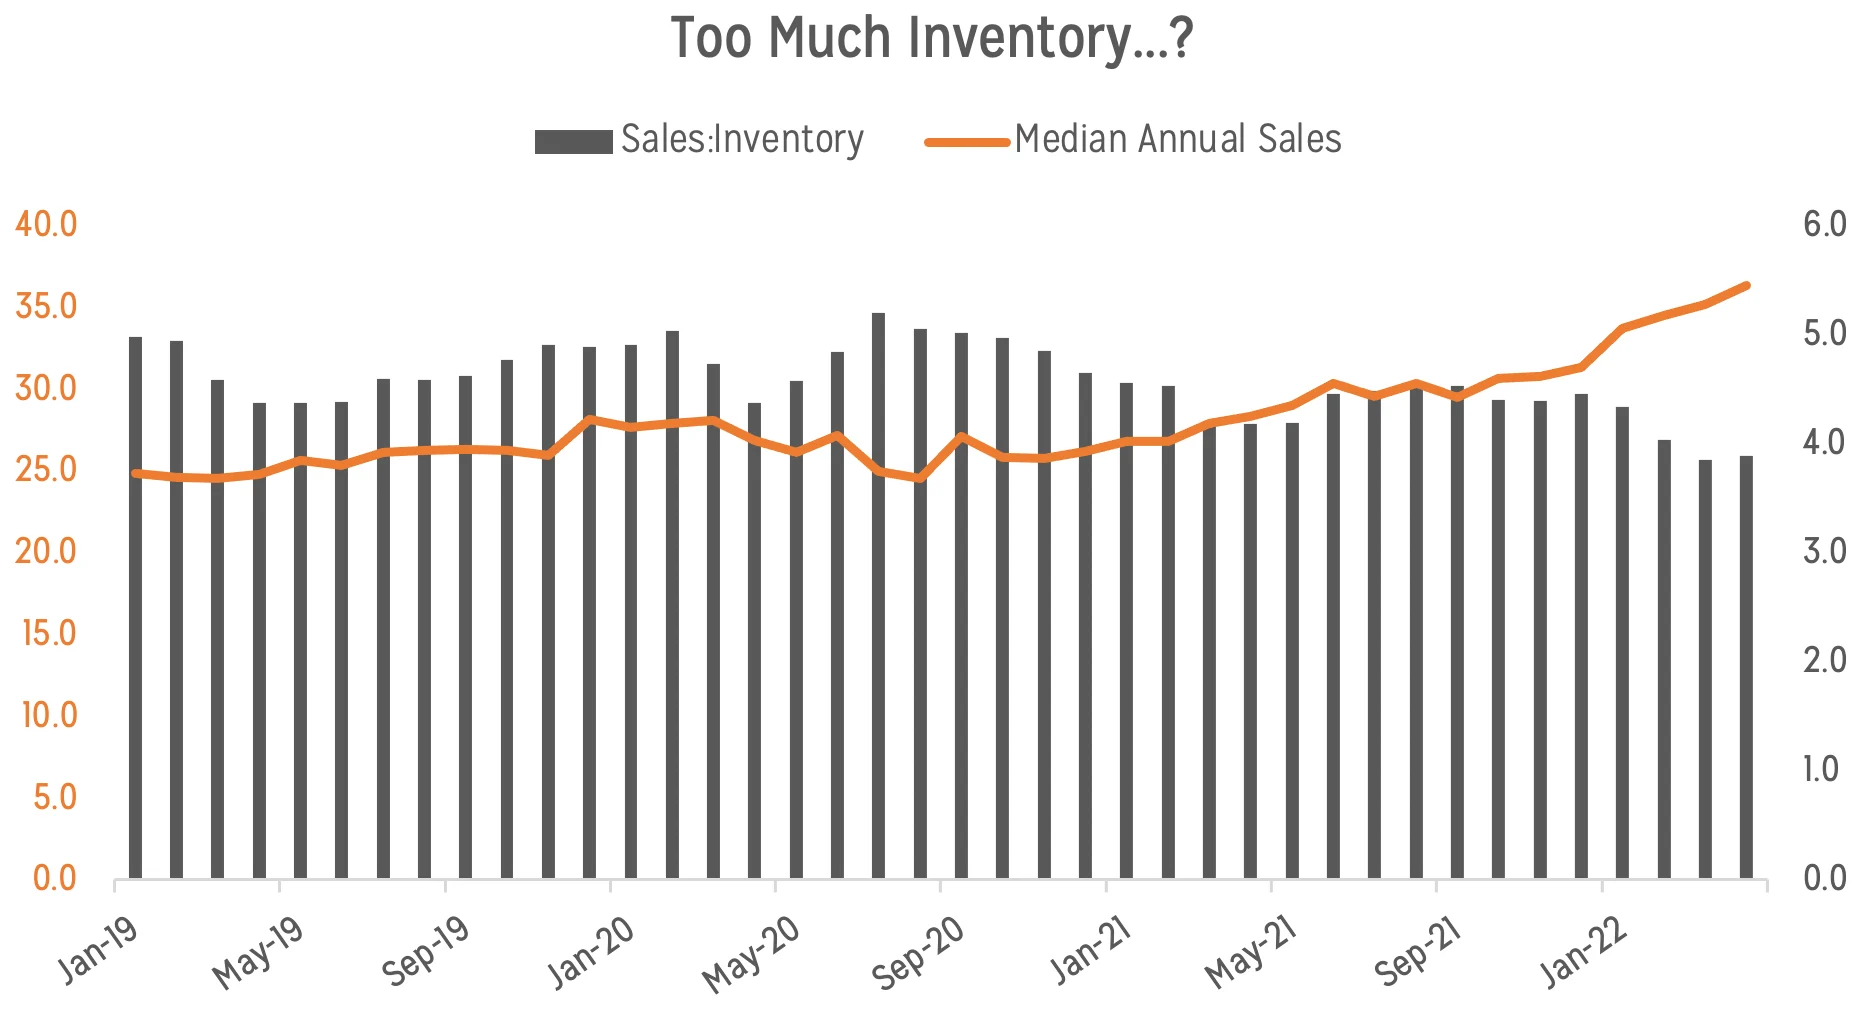
The chart above shows the annual sales total for the median HARDI distributor versus the sales-to-inventory ratio over time. During the only observable “normal” period for which we have data (January 2019 – February 2020), the average sales-to-inventory ratio over a twelve-month period is 4.7 (meaning the median HARDI distributor’s annual sales total is 4.7X greater than their average inventory value). Through April 2022, the 12-month trailing average sales-to-inventory ratio is 4.3, and 3.9 for the month itself. Based on our 2019 benchmark, the 12-month trailing average sales-to-inventory ratio implies that the median HARDI distributor is 9 percent overweight in total inventory. Data from the Census Bureau would seem to confirm the excess inventory hypothesis, with the sales-to-inventory ratio from the broader Hardware, Plumbing and Heating Equipment distributor category implying that current inventory levels are 4 percent greater than necessary. Yet, while sales totals and their relationship with inventory levels over time would lead us to believe that there’s too much inventory in the channel, average annual HVAC equipment sales by distributors have kept pace with the growth in inventory values.
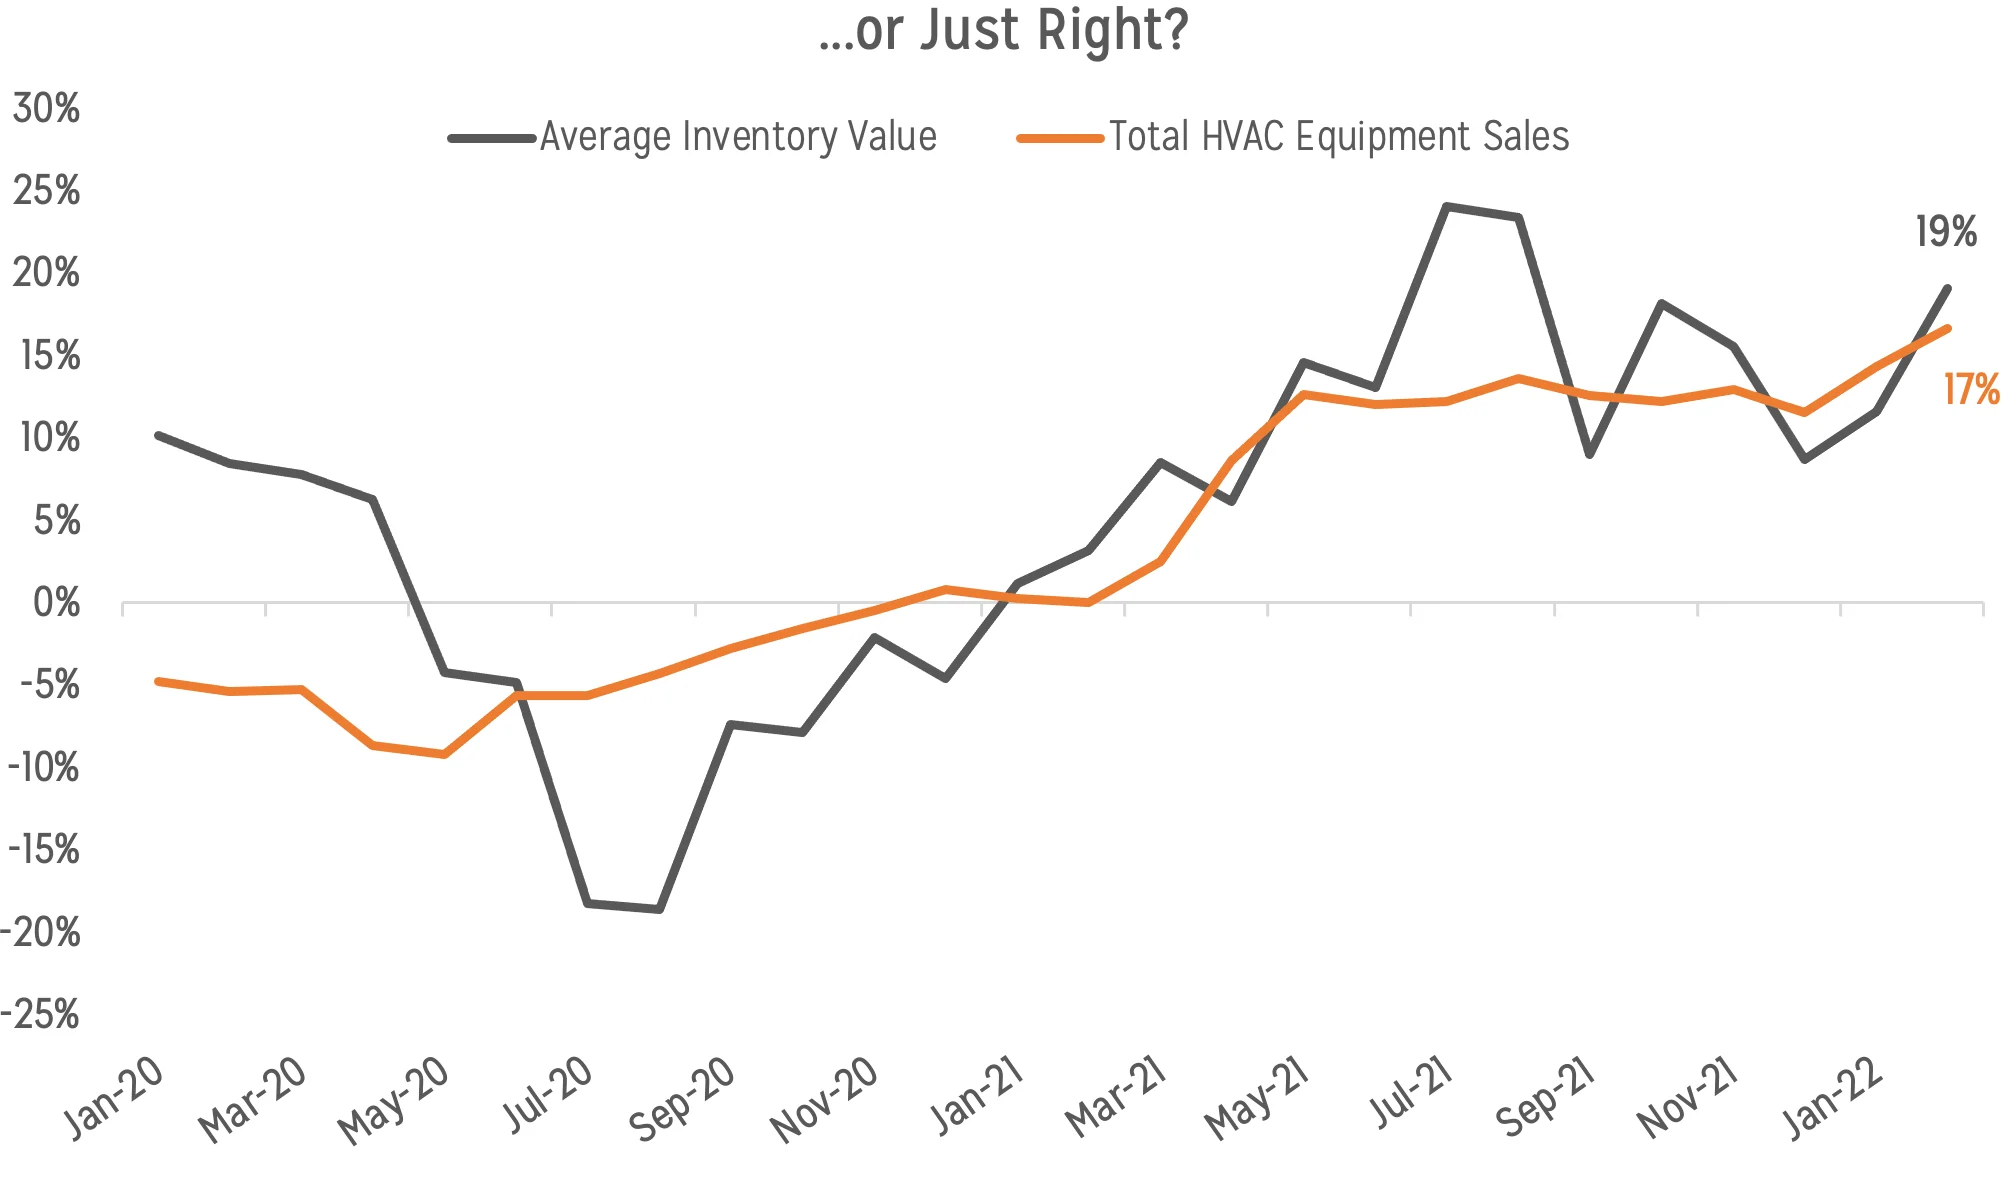
Note: The chart above shows the annual change in the 12-month average sales total of unitary equipment (which includes split and packaged ACs and ASHPs, furnaces, and boilers), plotted against the inflation-adjusted average inventory level for the median HARDI distributor.
Through March 2022, the 12-month average sales total of HVAC equipment by HARDI distributors nearly equaled the inflation-adjusted growth rate of inventory – equipment sales were up 17 percent versus 19 percent growth in inventory values. That equipment sales growth has generally kept pace with inventory growth – and HVAC equipment sales currently comprise >50 percent of the typical HARDI distributor’s sales – in many ways refutes the excess inventory hypothesis. Distributors may have higher than normal inventory levels, but not where it counts – namely, equipment. But how long will contractor demand continue to support the massive inventory investments distributors have made? In a recent post I argue that contractor job and quote trends show that end-user demand is still strong, and that demand has proven to be resilient in the face of rapid price increases. The following chart builds on that thesis, showing year-over-year trends in average weekly contractor hours and job totals.
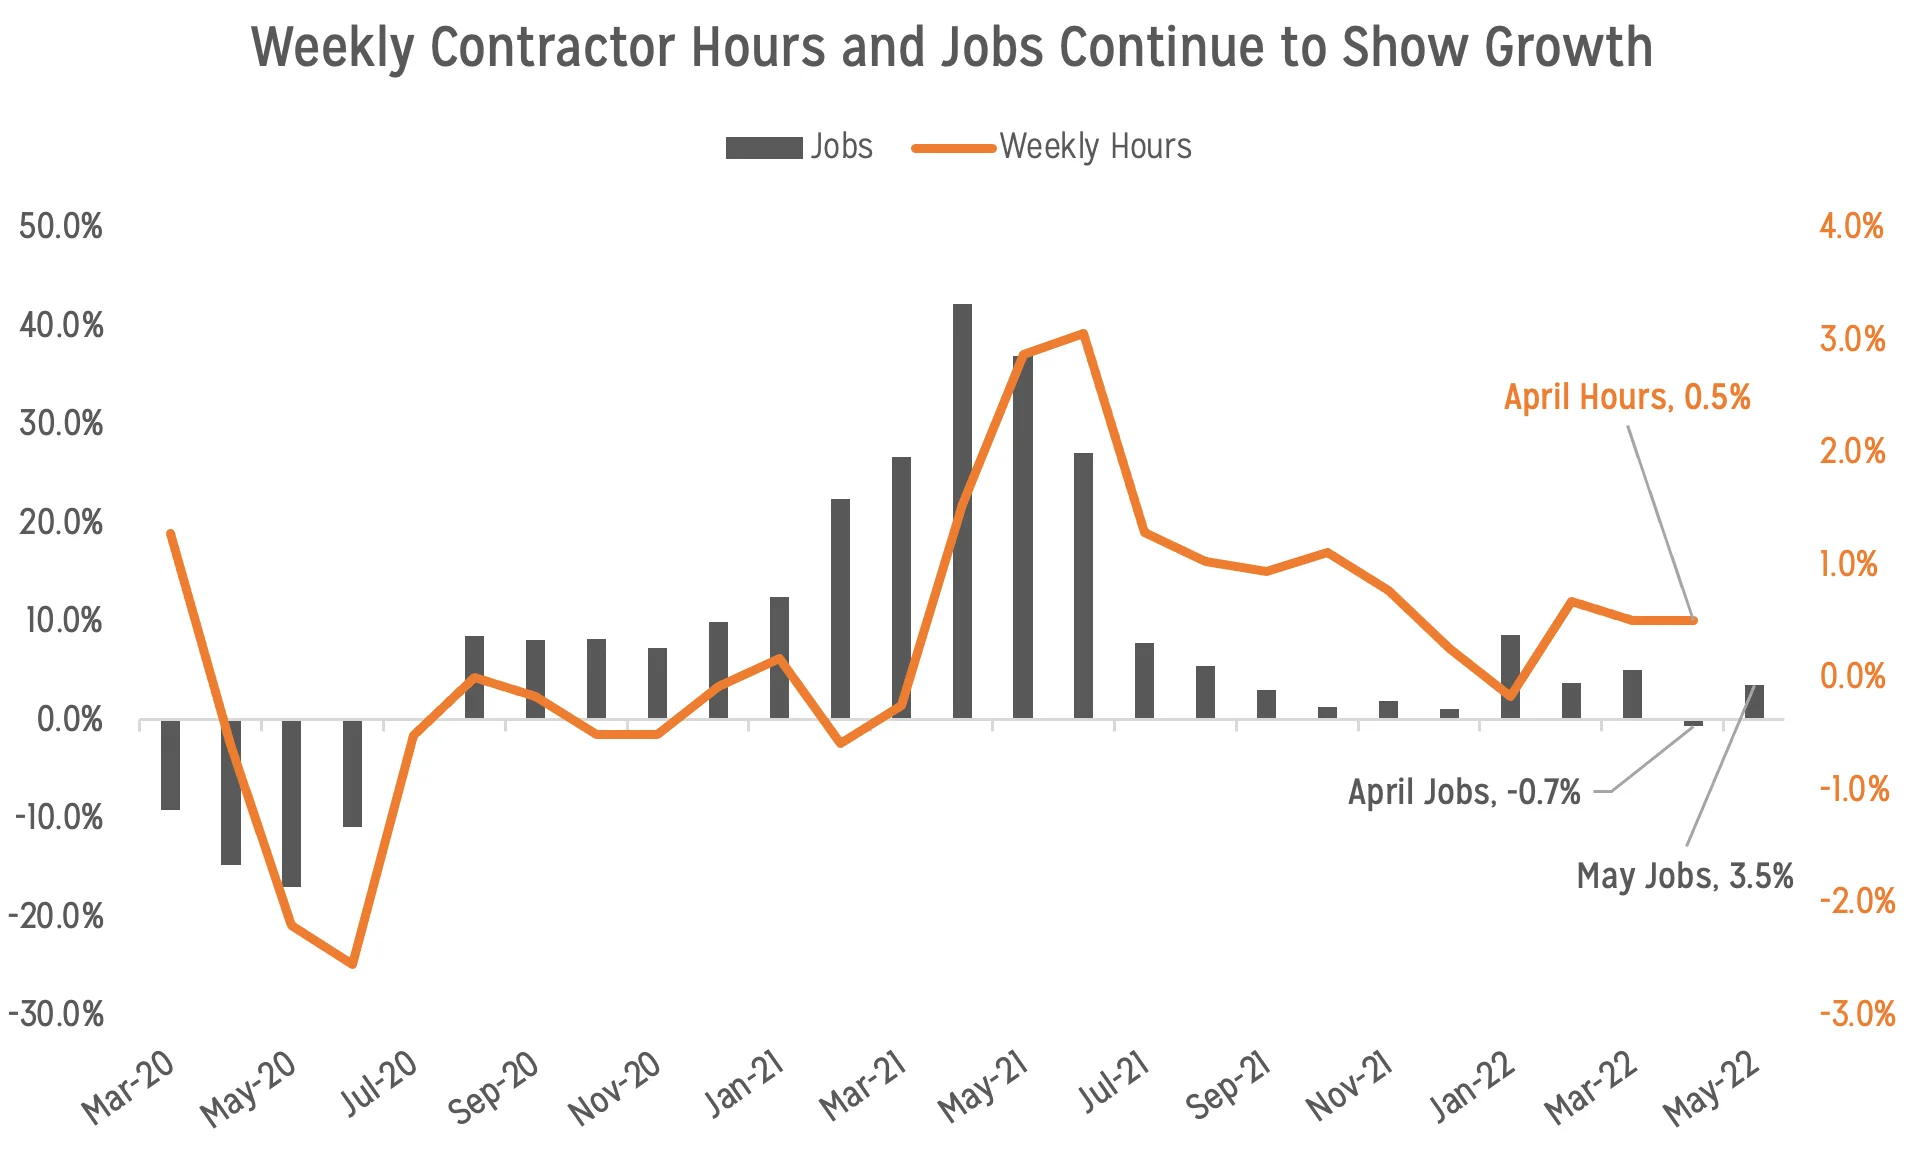
Note: The chart above shows the annual change in contractor jobs and average weekly hours for nonsupervisory & production HVAC/Plumbing contractors (which we refer to as “technicians and installers). Both jobs and weekly hours are shown as seasonally adjusted, 3-month trailing averages. FieldEdge has provided data through May 2022, and is displayed above, while average weekly hours comes from the Bureau of Labor Statistics and is currently only available through April 2022.
The average hours worked each week by contractor techs and installers were up 0.5 percent year-over-year through April, and job totals were up 3.5 percent through May (rebounding after a slight decline in April). While these figures are a great indication that end-user demand remains strong, HVAC is a regional business, and the demand picture is more varied sub-nationally.
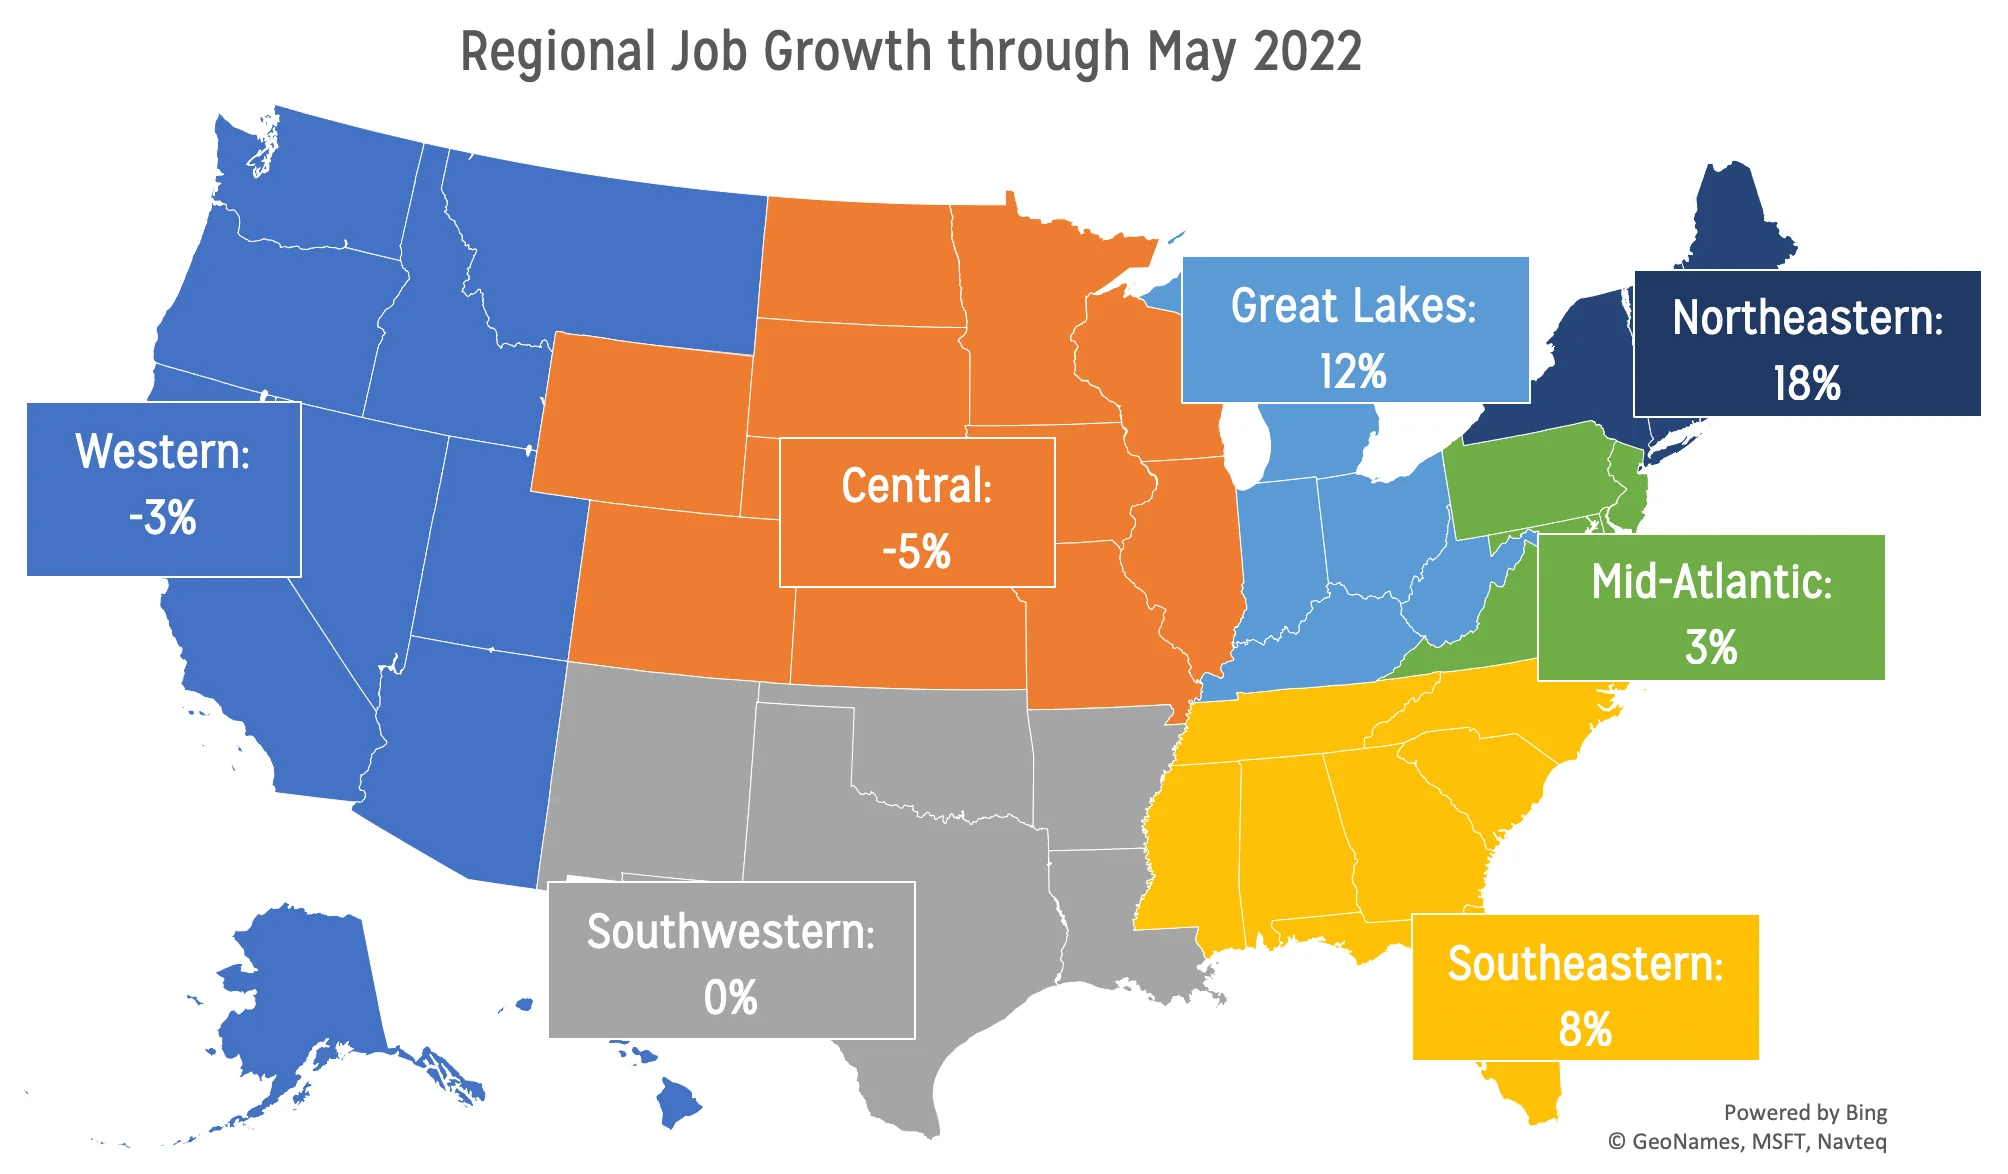
Note: The chart above shows the annual change in contractor jobs, by HARDI region. The figures in each region reflect the year-over-year change in job totals, after being seasonally adjusted and averaged over a three-month period.
Much of the current national demand growth is being driven by markets east of the Mississippi, with the Great Lakes, Southeastern, Mid-Atlantic, and Northeastern regions all showing healthy year-over-year growth rates through May. As for those regions west of the Mississippi, the flat-to-negative growth rates we’re seeing are relative to extremely impressive growth (>20 percent) one year ago. Resi demand, therefore, is showing little sign of weakness as we move into the most critical part of the year for distributors.
What then should we make of the bearish HVAC industry outlooks and weakening macroeconomic indicators? In the near term, price and interest rate escalation may produce demand headwinds, but to-date there is little evidence of waning demand. In the longer term, however, the fundamentals of residential demand remain strong. Notwithstanding the recent slowdown in mortgage applications, construction and demographic trends over the past 20 years have created a 2-3 million unit shortfall in available housing that will place upward pressure on housing demand in the years to come. Likewise, despite climbing shipment totals and replacement rates throughout the pandemic, we estimate that there are 31 million installed, ducted ACs and HPs that are >10 years old, based on recent survey data released from the Energy Information Administration. That figure represents a 1 percent increase in 10+ year old systems from pre-pandemic totals, meaning high replacement rates during 2020-21 have not pulled-forward demand in any measurable way. These factors, among others, imply that Covid-era trends have not fundamentally altered or placed a ceiling on future industry demand. Undoubtedly, the current breakneck pace of demand will slow at some point, but when it does the odds of a soft landing appear greater than a steep, painful decline.

Tim Fisher
Vice President of Research & Knowledge Management
Tim leads research and analysis of HVACR market trends, with a focus on wholesale distribution. His work is widely cited, and he was named an ACHR News Top 40 Under 40 professional in 2021. Before HARDI, he directed Government and External Affairs at CDFA, working on federal policy. He holds degrees from Ohio University (B.A., M.A.) and Ohio State (MBA).