Market Intelligence
Sweating the Numbers: Degree Days on Regional HVAC Sales
July 31, 2023 | 4 minute read

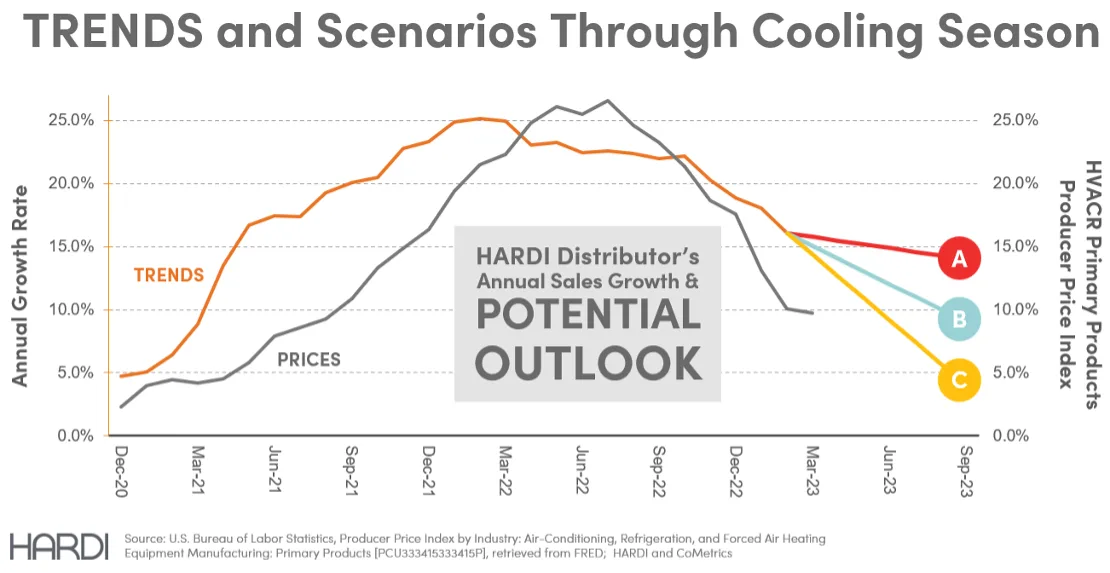
In a recent DDN we presented members with a question about which way they thought TRENDS would trend as shown in the graph below. As the growth in the industry returns to normal levels, a key driver of the annual growth rate will be how hot this summer is relative to last year. The intuition behind this one should be no surprise to anyone, more Cooling Degree Days (CDDs) means more cooling and more cooling means both new and replacement units. In fact, early in the cooling season, there is evidence that the first heatwave is especially effective at boosting sales for contractors. This article by Service Titan finds that the first heatwave in a season can lead to a 90% increase in daily revenue for contractors with diminishing returns until around the 5th weather event. They also find that temperature spikes in northern climates tend to result in larger increases in sales and we expect this relationship to carry up the channel to distribution.
The scenario proposed in DDN looks at how the cooling season shapes up across all HARDI members, but regionally cooling season can differ quite a bit as climates and end-user behavior differs. Cooling behaviors, especially late in the summer, matter more in hotter, southern states than northern where temperatures tend to be milder. I’d like to show analyses here to formalize how different region TRENDS figures interact with CDDs.
Northeast
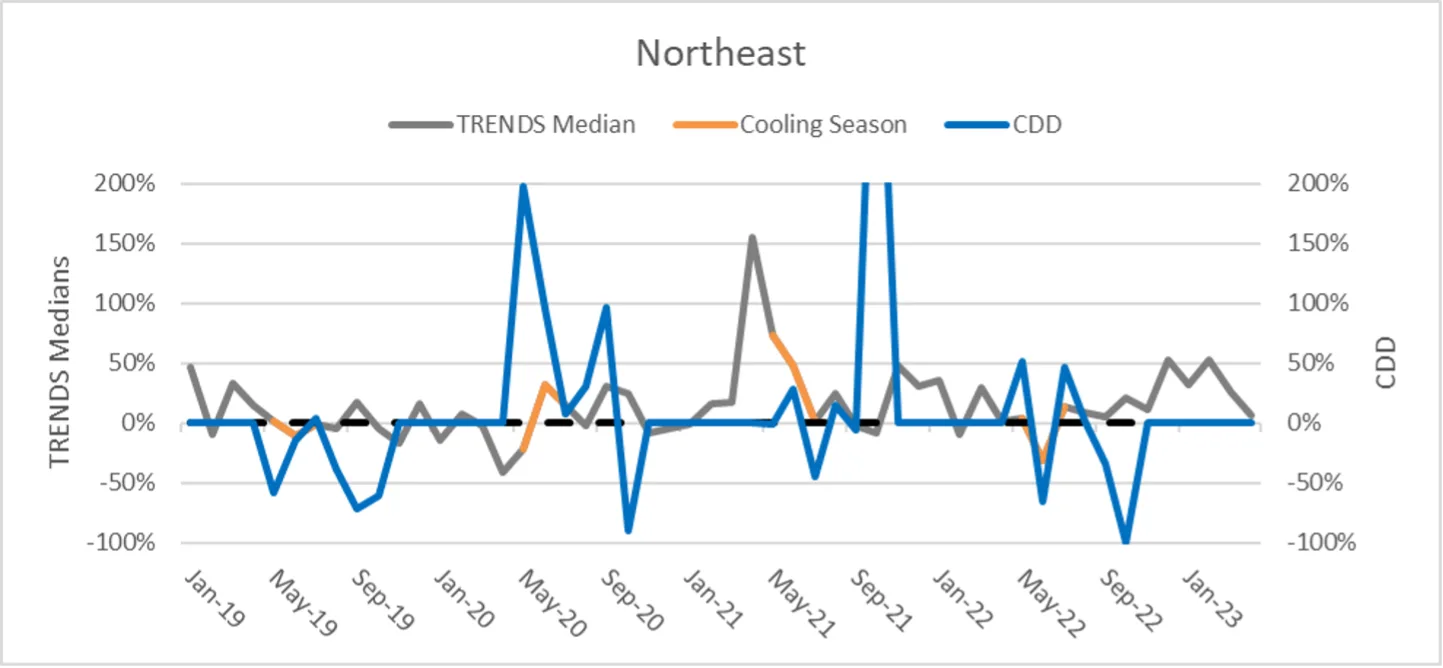
In the northeast region, cooling season tends to begin in May and peaks in July and August before trailing off into September and occasionally October in some years. In these states, there is a strong tendency for median TRENDS Y/Y sales growth to be positive when CDD Y/Y growth Is positive. Temperatures through May this year are also far below normal with a -91% reduction compared to May 2022.
Great Lakes
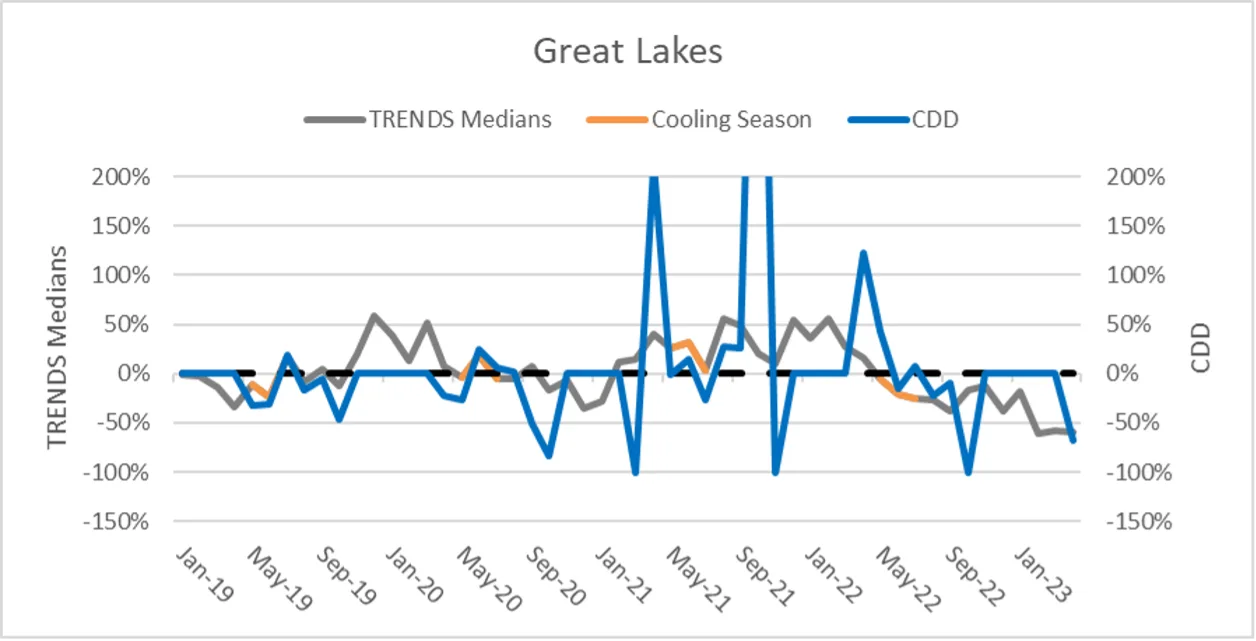
In the Great Lakes states, year-to-year changes in CDD by month can vary wildly, but the relationship between degree days and sales growth remains. Last year was a relatively comfortable summer and temperatures so far this year are showing no improvement. Median TRENDS in the Great Lakes have been steadily declining during the last 12 months as a result.
Mid-Atlantic
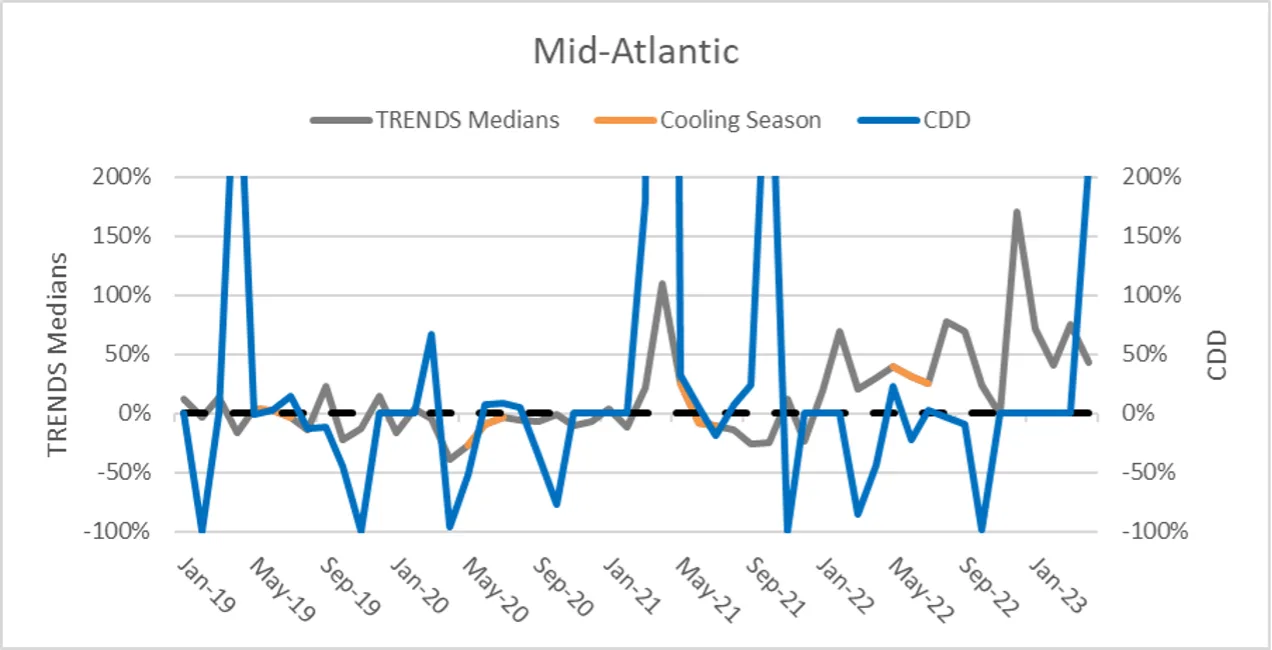
Like the Great Lakes, temperatures during hotter months vary wildly over time as the overall weather is more temperamental. May temperatures are down compared to last year, but the upshot is that April was unusually warm which will help as a sales buffer.
Southeast
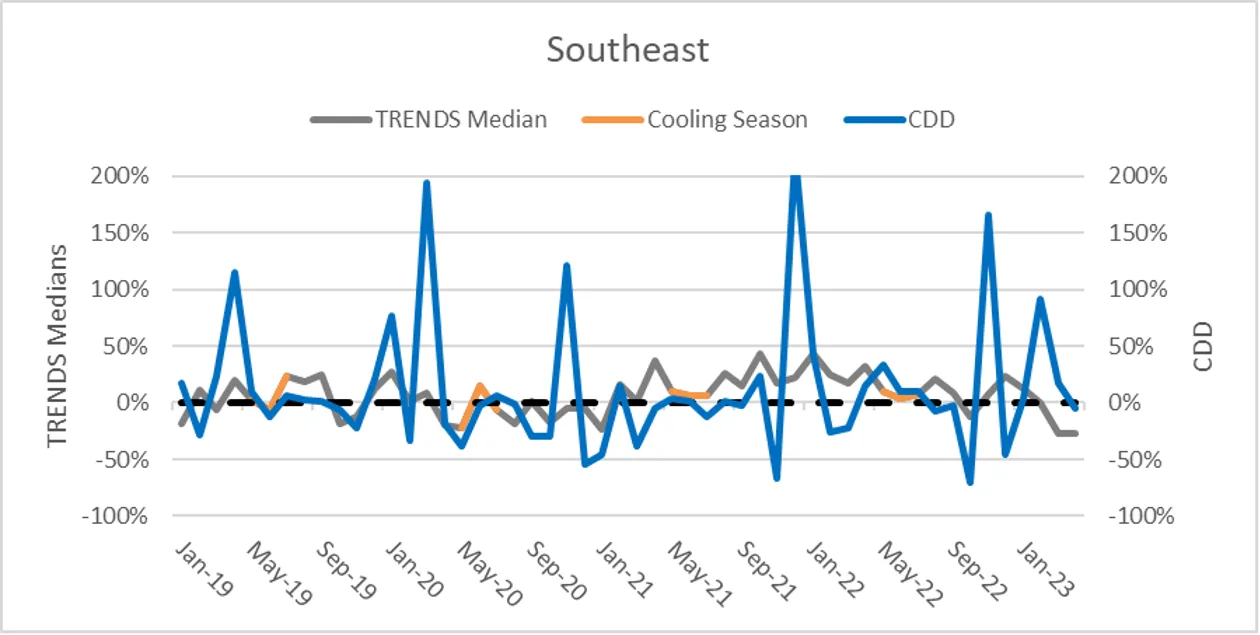
In contrast to the northern states and regions, the average degree days by month do not peak as sharply in July and have more spread into the winter months. This results in a slightly longer cooling season as well as a slightly weaker relationship between sales and temperatures.
Southwest
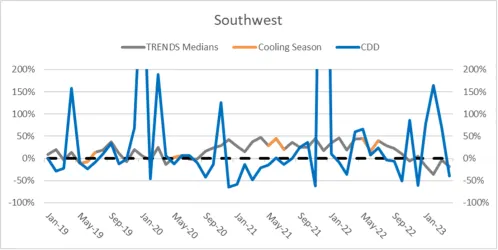
The Southwestern weather comp is comparable to the Southeast in both trend and relationship. In the last few years, Y/Y variations in CDD (especially during winter months) can spike wildly leading to brief increases in median TRENDS for the region. Late 2020 into early 2021 saw a steady increase in the reported medians, likely attributed to pandemic-related demand, that protected sales during periods where Y/Y cooling would have otherwise caused a negative effect.
Central
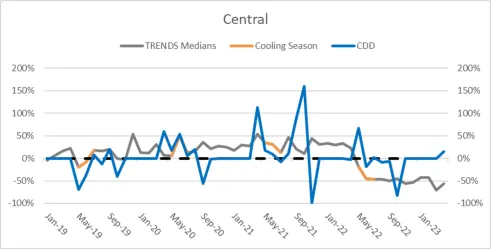
Central TRENDS is tied very closely to weather patterns and has one of the most well-behaved relationships in this regard amongst the HARDI regions. The weather comp last year was not favorable and unfortunately, this seems to be the case again going into May 23. The upshot, however, is that relatively, cooling in May was higher than normal which will hopefully insulate member sales from the poor Y/Y cooling growth.
Western
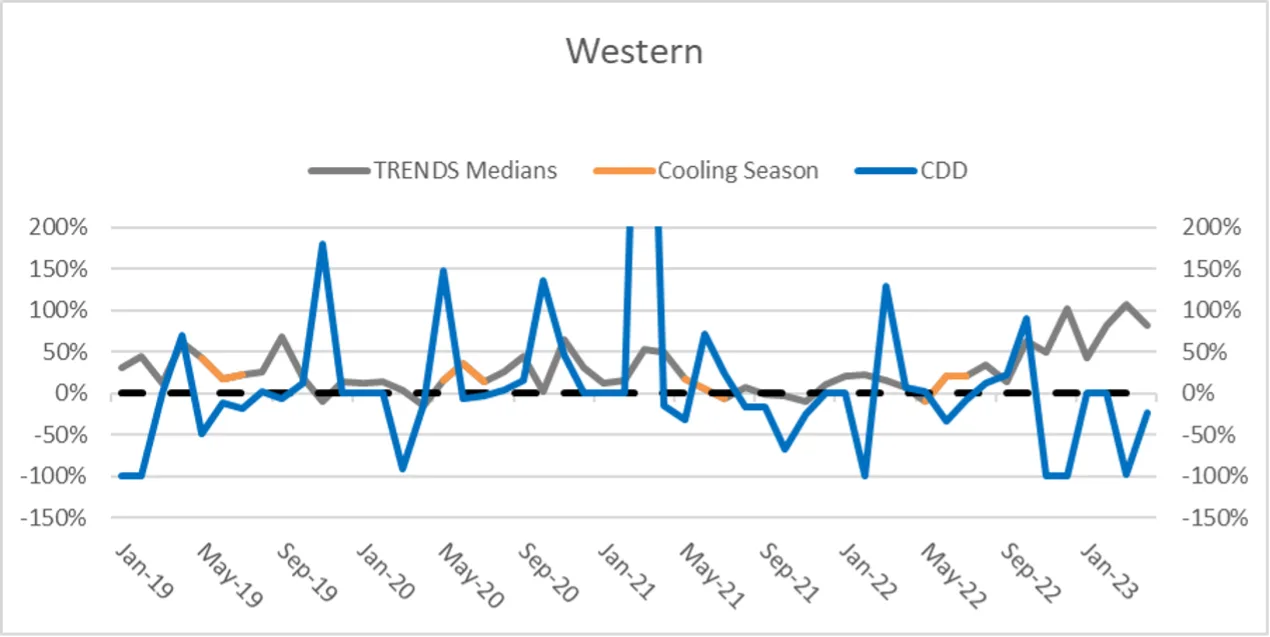
The weather-to-sales relationship in this region appears to be looser in these states. Even when annual changes in cooling shift down, median TRENDS sales have more moderate negative responses. Despite a worse weather comp going into early 2023, the median TRENDS figure continues to grow. Y/Y cooling changes in May of 2023 were the most moderately negative in the Western states which could explain this, however, overall cooling was far below normal, so it is hard to pinpoint the cause in the median growth.
Outlook
Across the board annual change in cooling has a direct impact on HVAC distribution sales. Especially during warmer months, hotter temperatures compared to the previous summer will often be a big influence on annual sales growth. So far May 2023 was a comfortable month for temperatures across the US and without a strong July, annual TRENDS growth will continue to regress back to the long-term norm. Despite a poor weather comp this year, the upshot is that it lends itself to potentially stronger year-over-year growth through 2024.

Tyler Drown
Former Quantitative Research Analyst at HARDI
Tyler previously served as an analyst on the Market Intelligence team, where he used his background in economics and statistics to deliver content on market insights that helped members make informed, data-driven decisions.