Market Intelligence
Sellers Just Flooded the Market. Buyers Didn't. What That Means for Fall Demand
September 14, 2026 | 5 minute read

Redfin's Balance of Power dashboard estimates how many homebuyers and how many home sellers are active in the U.S. housing market each month. The buyer side is what makes it useful to us. Redfin builds that estimate from the typical time between a shopper's first tour and closing. Existing home sales tell you what already closed. This tells you what is lined up to close.
In August there were an estimated 58% more sellers than buyers, up from 52% in July and the widest gap in Redfin's records going back to 2013. Redfin counts a gap wider than 10% in either direction as a buyer's or seller's market; anything inside that band is balanced.
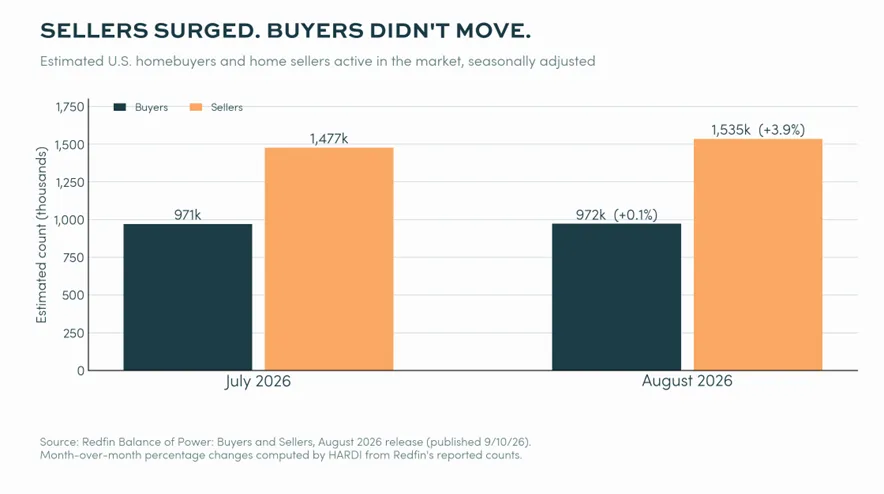
Chart 1. National buyer and seller counts, July and August 2026.
The mechanics behind that record aren't what the past few months would have suggested. Buyers came in at 972,300 in August, up 0.1% from July’s record low. Sellers jumped to 1,534,918, up 3.9%, the biggest monthly increase in Redfin's records and the most sellers in the market since the start of 2020. The record gap is a listings story this month, not a further collapse in demand.
Redfin's read on the surge is that current conditions are pushing longtime holdouts off the sidelines: sellers who spent years waiting for rates to fall, and owners with enough equity to negotiate and still walk away with a gain. Rates gave them little reason to keep waiting. Freddie Mac's 30-year fixed averaged 6.67% in August, up from 6.54% in July, and rose again to 6.71% in the first week of September.
Why this matters heading into the fall
Home sales pull HVAC work along with them. An inspection flags a 20-year-old furnace. A new owner replaces a system that had been limping along. None of that work happens on a house that never goes under contract.
What changed in August is that the closings turned. The National Association of Realtors’ (NAR) August existing-home sales, released this week, fell 2.0% from July and 1.2% from a year ago to a seasonally adjusted annual rate of 3.98 million — the first reading below 4 million since June 2025, and the third consecutive monthly decline. As recently as July, closings were still running 0.7% ahead of last year.
Both datasets agree on the supply side despite measuring it differently. Redfin counts active listings; NAR counts unsold inventory against the sales pace, and put total inventory at 1.62 million units, up 5.9% year over year and the highest since November 2019. Months' supply hit 4.9, which the Chief Economist of NAR called the highest in more than ten years.
Where it is worst
Of the 49 metros Redfin analyzed in August, 36 were buyer's markets, and in eight of them sellers outnumbered buyers by at least two to one, led by Nashville at 139%, Miami at 138% and Houston at 131%. All ten of the strongest buyer's markets are in the Sun Belt, four of them in Texas. Redfin credits the homebuilding pipelines in those markets, which keep adding inventory while demand cools.
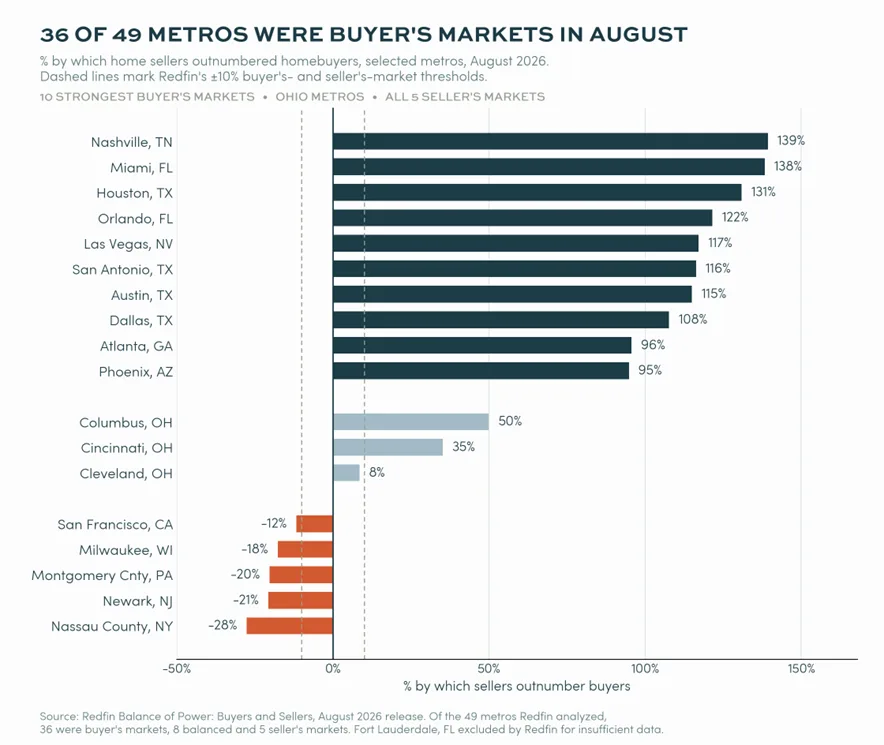
Chart 2. Selected metros by seller surplus, August 2026.
Ohio sat much closer to balance, with Columbus at 50%, Cincinnati at 35% and Cleveland at 9% — Cleveland has crossed back into balanced territory. Only five metros were seller's markets: Nassau County, NY, Newark, Montgomery County, PA, Milwaukee and San Francisco. Prices across those five rose 5.5% year over year, against 1.6% across the buyer's markets.
The metro picture also fragmented. The gap widened in 22 of the 36 buyer's markets and narrowed in 14, where in July it had widened almost everywhere. Orlando moved the most, from 100% to 122%, followed by Seattle and Las Vegas. Miami went the other way, from 149% to 138%, along with West Palm Beach and Fort Worth. The census regions are cleaner: the South widened from 83% to 91% and the West from 66% to 70%, while the Midwest held flat at 19%. Sun Belt branches are still reading a very different signal than the Great Lakes or the New York suburbs — but Florida is no longer moving as one market.
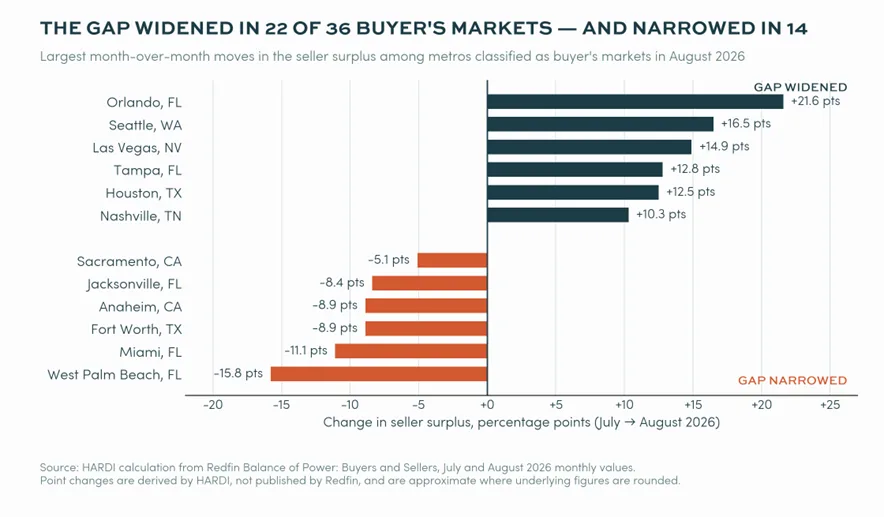
Chart 3. Month-over-month change in the seller surplus, largest moves.
What does this mean for your business?
Housing isn't the whole story for replacement demand, and the manufacturers don't agree with each other on where residential is heading. Trane raised its 2026 residential revenue outlook to mid-single-digit growth, citing first-half strength and normalized channel inventories, and Carrier pointed to improving residential and light commercial markets in the Americas. Watsco's domestic residential HVAC equipment sales rose 5% on 2% unit volume growth. Lennox went the other way, cutting full-year adjusted EPS guidance to $23–$24 and pushing the meaningful residential recovery into 2027. Read that one carefully, though: Home Comfort Solutions unit volumes fell 12%, but the decline was concentrated in one-step residential new construction the company chose to walk away from, and two-step volumes were roughly flat.
One piece of this cuts in distributors' favor. Redfin's economists are telling sellers to get homes prepped and telling buyers to negotiate for repair concessions, and we'd expect some of that to show up as service and smaller-ticket work rather than changeouts. We wouldn't expect it to make up for the closings.
One thing to watch in next month's release: the buyer count, not the gap. The gap can widen on listings alone, as it did in August, and that's a different signal than buyers walking away.
Get the Full Picture with the 2026 State of the Channel Report
For a more robust and up-to-date analysis of the HVACR industry's trajectory, check out the 2026 State of the Channel Report, available for purchase now. HARDI members can also track unitary sell-through by state and product category in the Unitary Market Program dashboards — participation is a free member benefit.

Joey James
Senior Research Analyst
Joey James is a Senior Research Analyst on HARDI’s Market Intelligence team. He has over a decade of experience delivering data-driven insights across the public, private, and nonprofit sectors. He has worked in markets around the world, helping organizations make better decisions through market analysis, impact assessments, and forecasting. He is passionate about turning data into insights that drive growth and improve outcomes.