Market Intelligence
Jobs Without Takers: A look into employment shortages
May 2, 2024 | 4 minute read

The job market has been a challenging space to navigate as of late. Members in all parts of the country have been experiencing labor challenges without much relief. Month after month, job reports remain positive but it’s just not satisfying demand. Even with record job creation, the US is short-staffed.
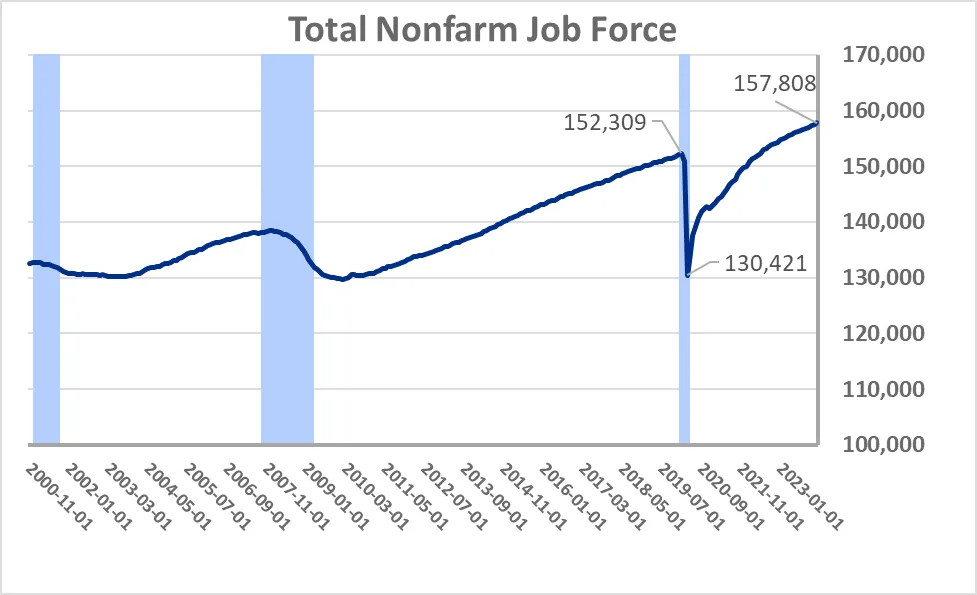
Covid caused quite the employment mess between January 2020 to January 2021 and resulted in 23 million jobs being lost. Peak unemployment came in April 2020 with a rate of 14%. Since then, jobs have been added back at a tremendous rate. Now in 2024, the total number of people working has surpassed pre-pandemic levels, but some metrics are lagging. Workforce participation dropped in the Covid-era, but is slowly returning towards pre-pandemic levels.
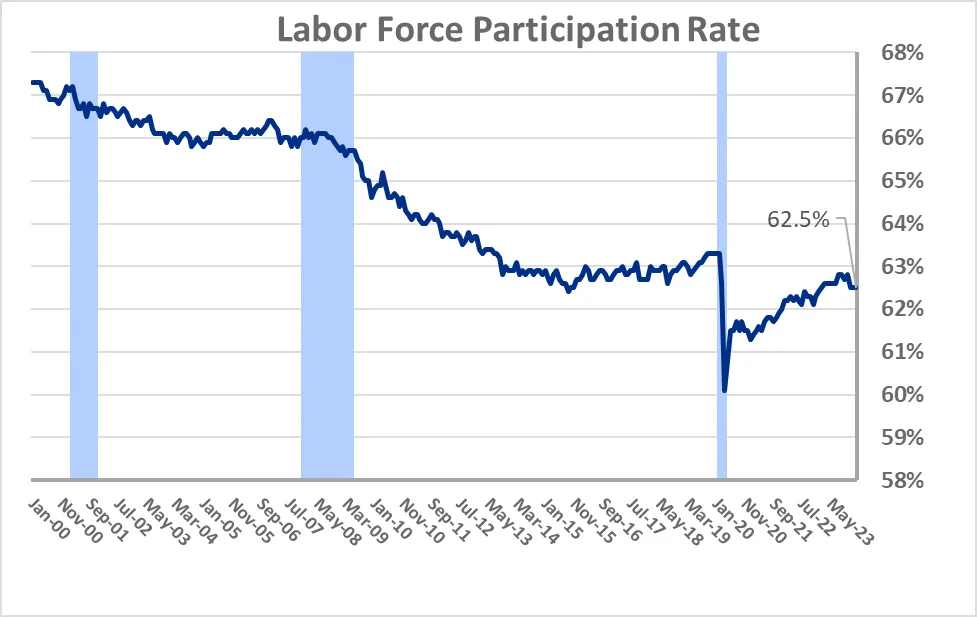
Above is the labor force participation rate, which represents the number of people in the labor force as a percentage of the civilian institutional population.1 Even before Covid, the participation rate was historically low, but Covid sunk it even further. The February release listed the current job participation rate at 62.5%, a decline from 63.3% in February 2020. This is due to the aging workforce and not enough new entrants to replace them. This drop is a key indicator of the shortage of workers. If the US labor force participation rate today matched February 2020, an additional 2.1 million Americans would be a part of the workforce. The percentage differences are nominal, yet it would bring sizable relief.
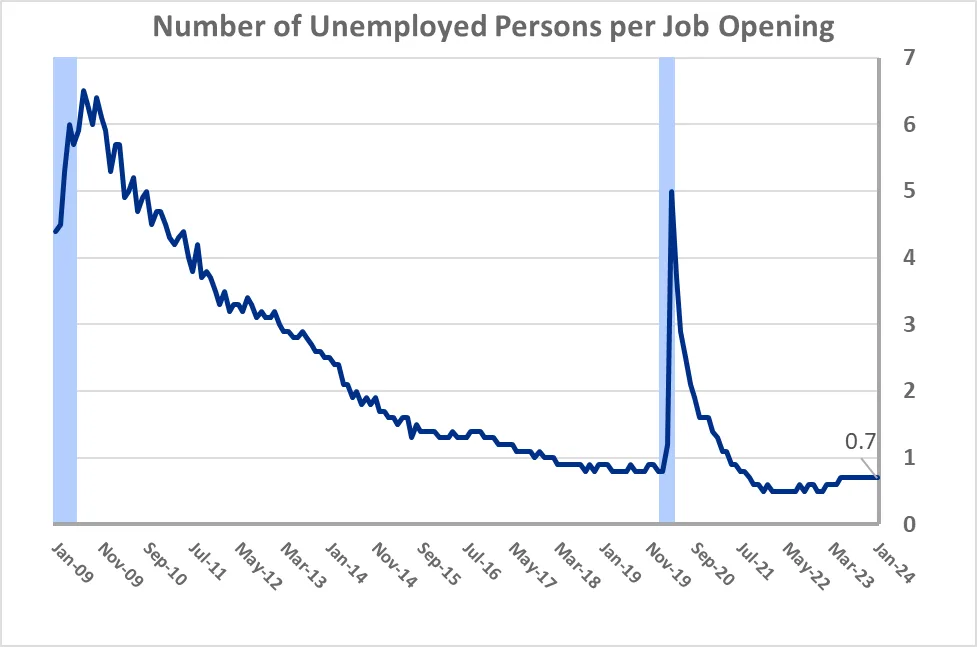
According to the latest jobs report in February, there are about 6.5 million unemployed people and 9 million job openings. The unemployment rate is a key economic indicator that measures the percentage of individuals in the labor force who are without a job and actively seeking employment. Above are job openings divided by unemployed workers. You’ll notice that even before Covid, there were more openings than workers. Currently, there are 0.7 unemployed workers for every job posted or about a 3-million-person shortage. Even if the labor participation rate mirrored the pre-Covid trend, there’d still be 1 million more job postings than unemployed workers.
Year | Labor Force Participation Rate | Workforce (Millions) | Unemployment Rate | Unemployed per Job Opening |
2024 Q1 | 62.5% | 157.81 | 3.94% | 0.70 |
2024 Q2 | 62.7% | 158.16 | 4.12% | 0.75 |
2024 Q3 | 62.7% | 158.41 | 4.17% | 0.77 |
2024 Q4 | 62.7% | 158.58 | 4.21% | 0.78 |
2025 Q1 | 62.7% | 158.75 | 4.28% | 0.79 |
2025 Q2 | 62.7% | 158.89 | 4.26% | 0.79 |
2025 Q3 | 62.6% | 159.04 | 4.27% | 0.80 |
2025 Q4 | 62.6% | 159.17 | 4.25% | 0.79 |
Are there any prospects for improvement in labor market tightness? The chart above includes forecasts from Moody’s Analytics that cover the various metrics previously mentioned. Labor force participation isn’t forecasted to change much by 2025, but the total workforce is expected to increase by about 2 million. Moody’s also estimates some relief, as the unemployed per job posting gets closer to about .8 listings per unemployed worker at the end of 2025. This is mostly due to the unemployment rate ticking up a quarter percent to a low of 4.25%. These forecasts imply that the demand for workers will start to decrease as the economy returns to normal after the past few years of a Covid-fueled boom.
1 The civilian noninstitutional population refers to people that are older than age 16, are not inmates of institutions (e.g., penal and mental facilities), and those not on active duty in the Armed Forces.
Read More HARDI Market Intelligence Insights
With everything that's happening in the world around us it can be difficult to stay up to date on all the latest trends and news impacting the HVAC industry. Get the latest news and insights from HARDI's blog and search what you need by category: Market Intelligence, Talent Development, Government Affairs, and More!
For more Market Intelligence insights, read more content here.

Jake Miller
Research Analyst
As a Research Analyst on HARDI's Market Intelligence team, Jake leverages his education in finance and real estate from the University of Cincinnati to provide industry insights and benchmarking programs for HARDI membership. He has a strong foundation in analysis and statistical methods, which he utilizes through in-depth research work to develop membership insights.