Market Intelligence
Are Contractor Hours a Useful Indicator?
July 10, 2023 | 4 minute read

For the last several years in State of the Channel, we have used changes in Plumbing and HVAC contractor hours as a proxy for changes in contractor sales and therefore for contractor demand, but I want to take a quantitative look at exactly how hours align with distributor sales. The narrative is simple if perhaps oversimplified: end users demand some amount of repair and replacement services from contractors which in turn demand some quantity of units and parts from suppliers and distributors resulting in distributor sales. The Census data on aggregate weekly hours for Plumbing and HVAC contractors should capture growth in replacement (and some repair) demand.
For us at HARDI, knowing how these data points interact with each other helps us provide better forecasting and analysis in the content we publish. For the average distributor though, you may find yourself wondering why you should care. For the data-minded it could aid in your own projections and forecasting and for others it can offer a heuristic for assessing the strength of your customer base on the local level or assessing a new region to expand into.
Historic Trends
Probably the most intuitive and effective way to examine this relationship is graphically. The first row of plots below shows a combination of aggregate Monthly Wholesale Trade (MWT) sales as well as monthly national mean TRENDS sales, seasonally adjusted against contractor hours. While not always perfectly in lockstep, MWT sales and contractor hours follow nearly identical growth patterns over the last 10 years. In 2020-2021 with the pandemic supply chain shock, the synchrony of these two times series becomes readily apparent. Over the last 2-3 years, there is some statistical evidence discussed later that suggests contractor hours become a lagging indicator instead of a concurrent one, but whether this is a short-term relationship as a result of a disrupted market, or a longer-term change in the channel remains unknown. The second row of plots have had both their seasonal components, as well as upward trends, removed to show how the two datasets move together more clearly.
Taking a step downwards from National Aggregates, we can compare the same contractor hours to changes in national median TRENDS figures to remove most of the effect that Plumbing and other non-HVACR products included in MWT figures. While the TRENDS figures have much more variance as expected from a significantly smaller sample size, the overall fluctuations and pattern between the data match that of the MWT. TRENDS in 2023 digress slightly from the movement of hours, but I would not expect this pattern to be a long-term one.
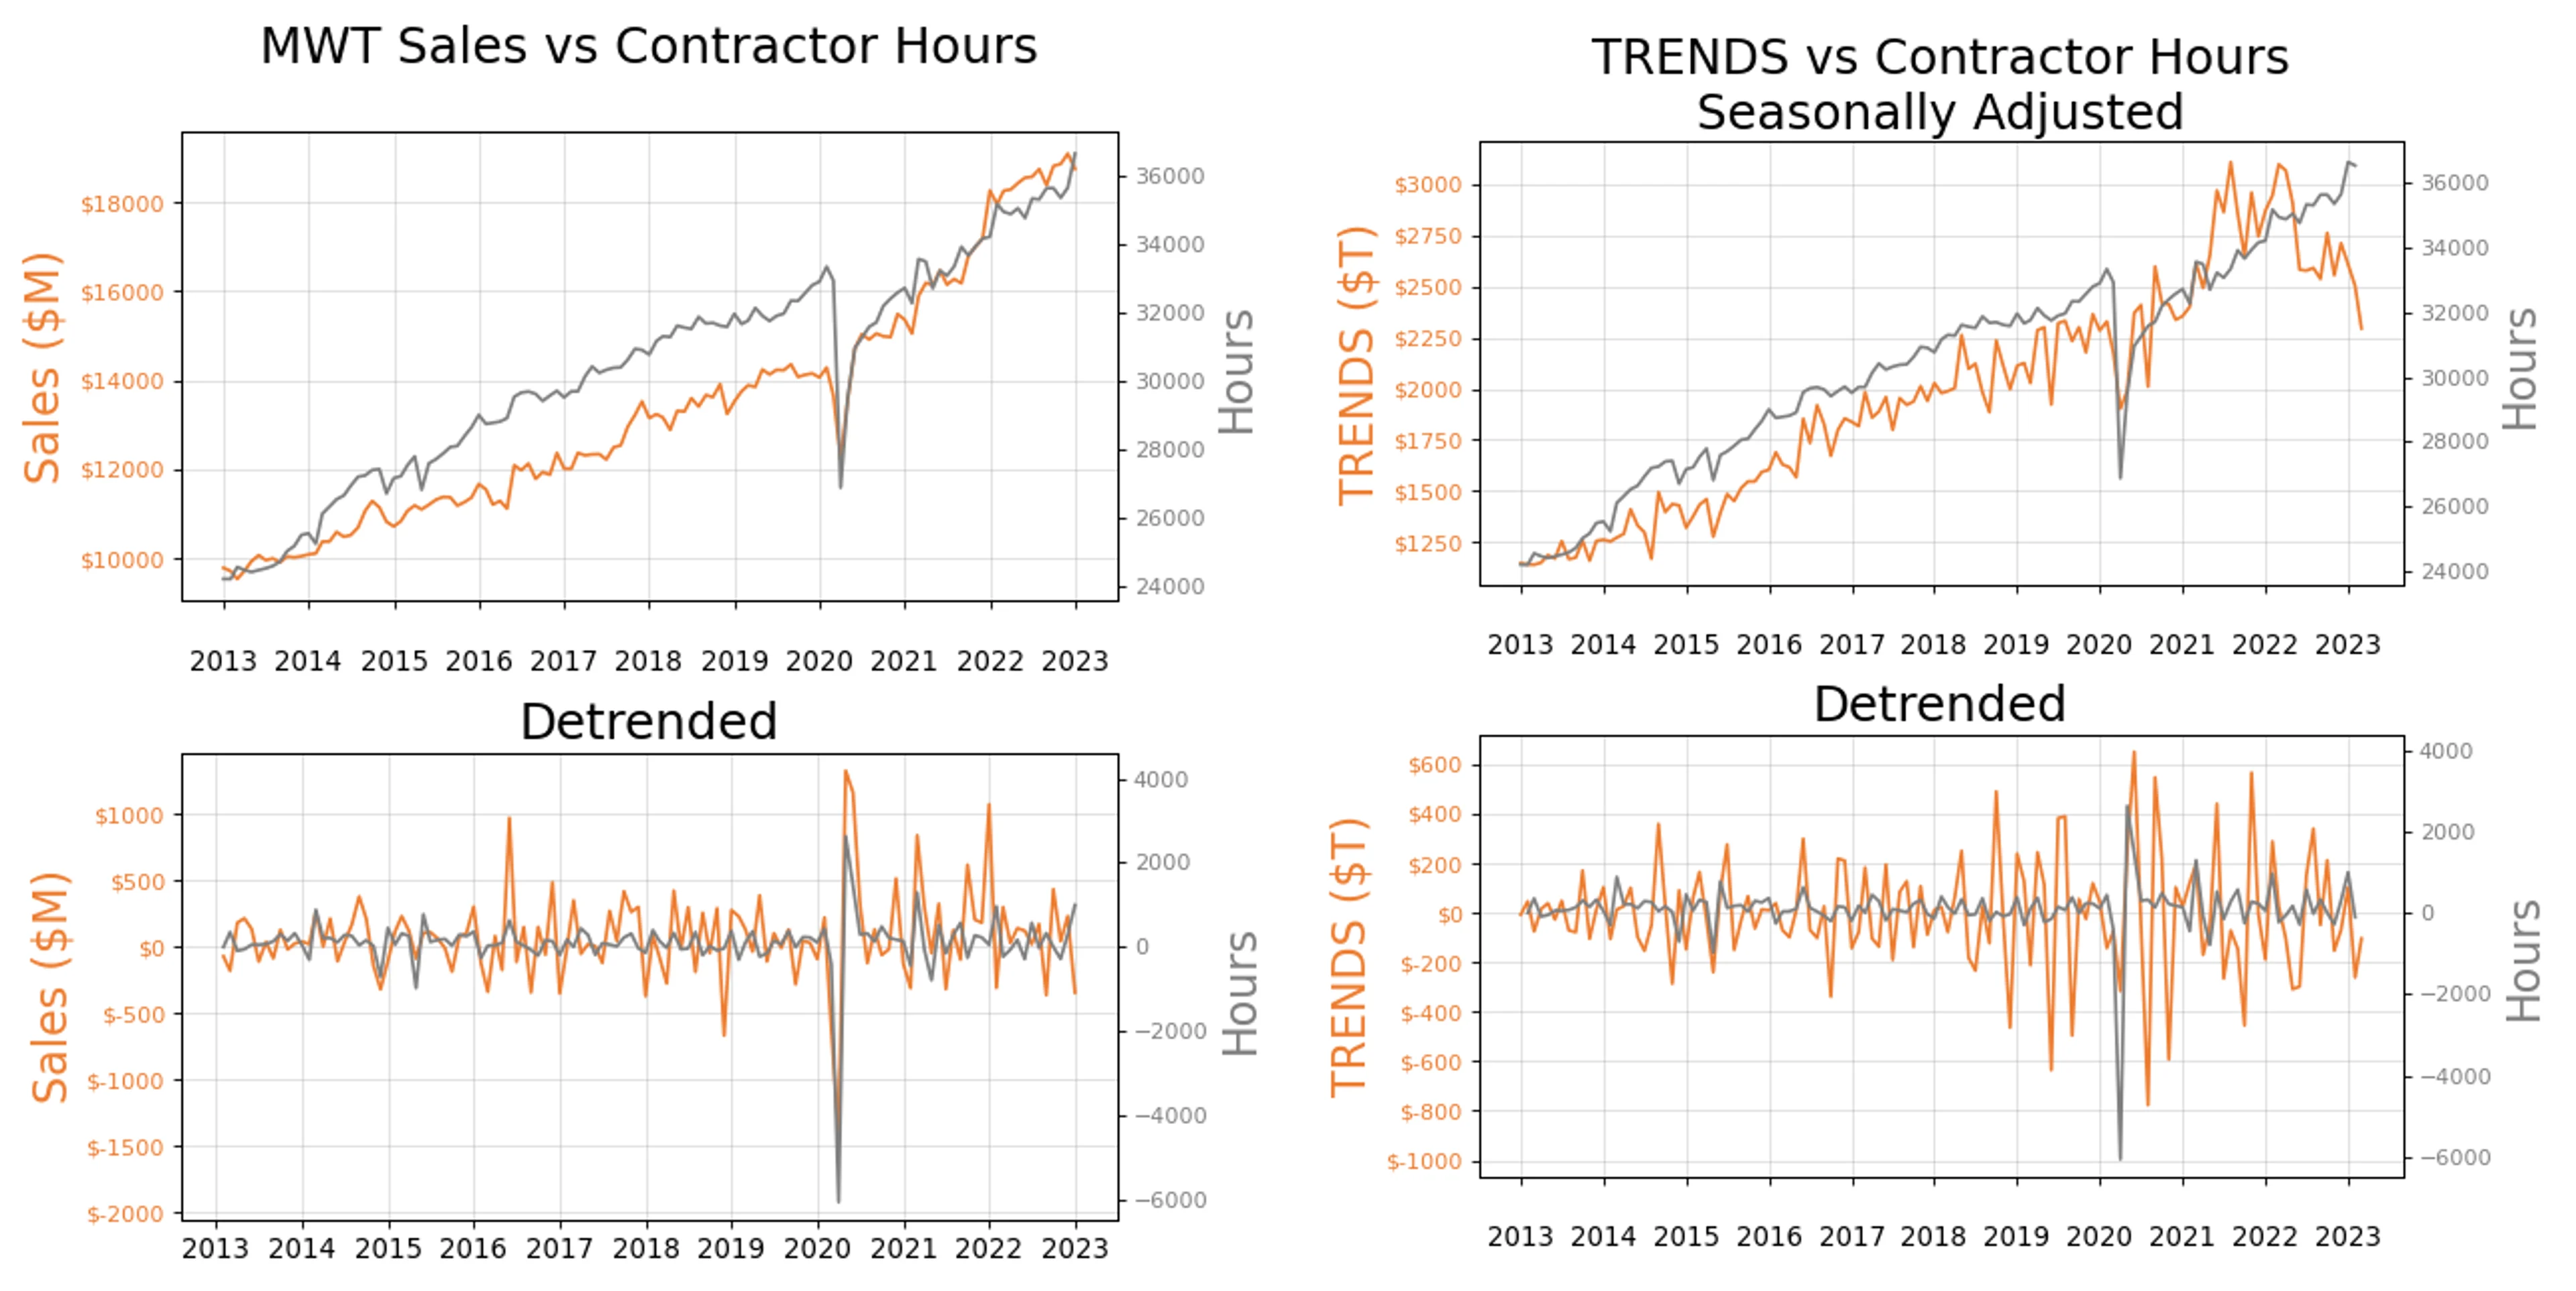
MWT Sales and Contractor Hours are seasonally adjusted by default. TRENDS National Median Data has been presented with seasonality removed via STL decomposition. MWT Sales and Contractor Hours were first-differenced, and TRENDS was second-differenced to provide stationary, detrended data.
Other Measures of Contractor Demand
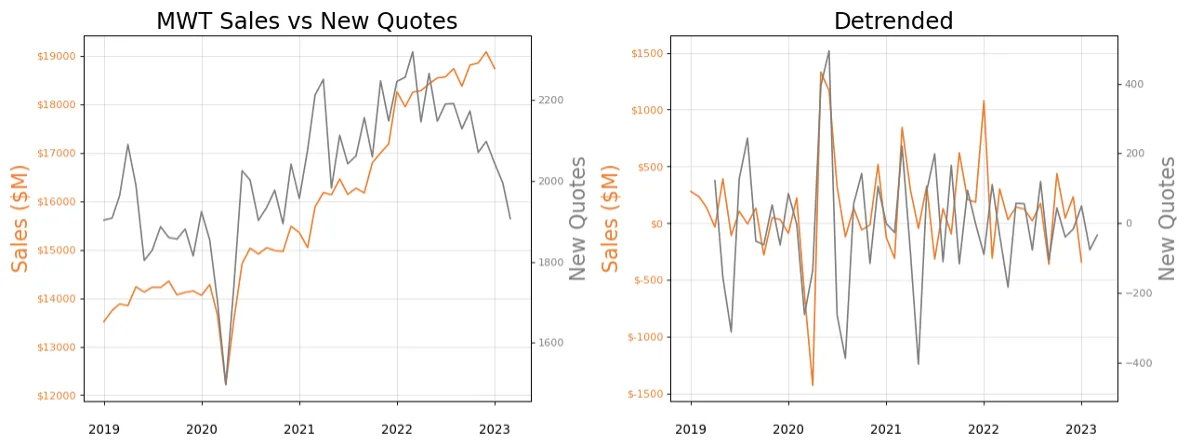
In my recent blog post regarding distributor inventory values, I used Field Edge “New Quotes” data as a proxy for contractor demand. These variable measures the average number of new quotes issued by Field Edge users during a given quarter. Quotes are typically given for new systems and not repair jobs, making them a good tool to approximate contractor demand. Once again in the plots below, we can see that changes in quotes relate very closely to distribution sales.
Further Discussion
As I mentioned previously, there is also some statistical evidence that in the last few years, Sales appear to lead Hours. One way to formally test this is to apply a statistical test for Granger Causality. This test evaluates whether one set of data is effective at forecasting a second set of data some set amount of time in the future.
Results of this test show that using the last 10 years’ data for Sales and Hours, Sales have a statistically significant ability to forecast hours one month later, but this relationship does not exist the other way around. Graphically, this seems to be driven by 2020-2023 which is confirmed by the test failing when limiting the data to before 2020. There could be many explanations for why this might be happening. It could simply be a result of supply chain disruptions in lead times, differences in contractor inventory policies, placing more orders ahead of time or a myriad of equally likely explanations. Over time we will see if this relationship continues, which may affect how we at HARDI use this information in our analysis and forecasts, but in the meantime, contractor hours remain a reliable indicator for channel health.

Tyler Drown
Former Quantitative Research Analyst at HARDI
Tyler previously served as an analyst on the Market Intelligence team, where he used his background in economics and statistics to deliver content on market insights that helped members make informed, data-driven decisions.